As discussed in the previous post , Inventor exposes its programming interface using COM Automation technology. A COM Automation interface is an object oriented type of interface. This means the API defines a set of objects and these objects have various functions (methods and properties) that allow you to query, edit, and create new objects. For Inventor’s API, most of the API objects will already be familiar to you because they represent the same things you’re working with when you use Inventor interactively, (which is why it's important to have a good knowledge of Inventor before attempting to use the API). For example, in the API there is a Parameter object that represents a parameter in a part or assembly. The Parameter object supports methods and properties that allows you to query and edit the parameter it represents. For example, a Parameter object has a property called Name that will return the name of the parameter and you can set the value of the property to change the name of the parameter.
The Object Model is an important concept to understand in order user the API. The API objects are linked together in a logical way. In order to get a certain object you need to understand how they're linked because you'll need to go from one object to another to get to a specific object. The structure of the objects is referred to as the object model. The object model is typically represented as a hierarchal chart that shows the relationship between objects. If you’re familiar with C++ class diagrams, this IS NOT the same as that. It does not show a class hierarchy but illustrates an ownership hierarchy. For example, a dimension constraint is owned by a sketch, it's not derived from the sketch. If you have a reference to an API object you should be able to traverse the object model to access any other object as long as you understand the structure of the object model.
There are a few tools available to help you view and understand this object model:
-
Object Model Chart – This is a chart that illustrates the object hierarchy. It’s most useful in a hard copy form because of it's size it's hard to view on a computer screen. Initially, it can look a bit overwhelming because there are so many objects but because you’ll typically just be using a few objects within a certain area of the API you'll end up learning it in small pieces.

Object Model Chart (click to expand in a new window)This chart is delivered as part of the Inventor API SDK (Software Development Kit) but you can also download it here.
- Online Help – Part of the programming help that’s delivered with Inventor contains a description of every object along with details about the methods, properties, and events each object supports. You access the programming help from the Help menu in Inventor.

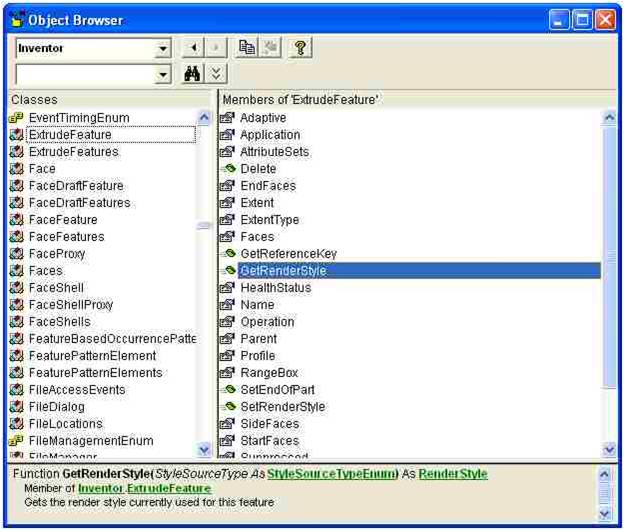
Inventor API Programming Help (click to expand in a new window) - Object Browser – The object browser is a user-interface for viewing the objects and their associated methods and properties. Object browsers exist in various forms in the different languages but the object browser that's part of VBA is probably the best for viewing Inventor's objects. From within VBA you show the object browser by running the Object Browser command (F2). The drop-down in the upper-left of the Object Browser dialog lets you choose which programming library you want to view. The field below that allows you to search the library. The dialog contains two main areas. The one of the left is a list of all of the objects in the selected library. When you select an object, the area on the right shows the methods and properties of that object. Selecting a method or property will display specific information about it at the bottom of the dialog.
-
VBA Debugger – The VBA debugger is also useful outside of the normal context of debugging a program. Because of VBA’s support of COM Automation it allows you to examine live objects and their properties while traversing through multiple levels of the object model. This is an extremely powerful and useful tool no matter what language you’re using, and well worth learning how to use.
If you're unfamiliar with debugging in VBA, here's a crash course.
- Have Inventor running and a part open that contains a few features.
- Open Inventor's VBA development environment (Alt-F11).
- Double-click on a module in a project to open a code window. In the picture below it's Module1 from the ApplicationProject.
- Create the Sub as shown in the picture below.
- Position the cursor anywhere within the Sub you just wrote and press F8 to start debugging.
- Right-click the mouse over ThisApplication and choose "Add Watch…" from the context menu. Click OK on the Add Watch dialog.

Using the VBA Debugger (click to expand in a new window) -
VBA will open the Watches window with the variable you selected displayed in the window, as shown below. The object shown in this example is the Application object. The Application object represents the entire Inventor application and is the top most object in the object model. You can click the "+" next to the name to expand the object to show its properties. Each property shows its current value, or if the property returns another object it will have a "+" next to it. You can traverse through the hierarchy by expanding the plus signs.
This provides a live view of the object model. In the example below, the ActiveDocument property is expanded to show the currently active document. For a part, most of the interesting information is contained within an object called PartComponentDefinition which is returned by the ComponentDefinition property of the PartDocument. You'll see this object provides access to parameters, features, and other part related objects. Playing with this, along with the object model chart, you can get a better understanding of the object model.

VBA Watch Window (click to expand in a new window)


Leave a Reply